August 19, 2019 • Ofir Ashman
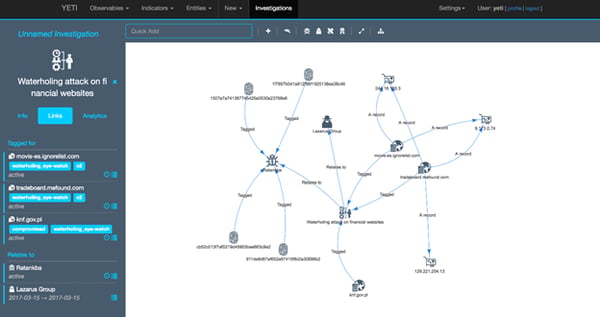
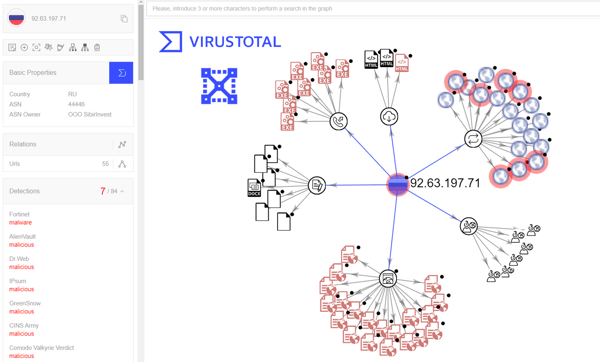
ThreatSTOP Free Open Source Analysis Tools Series. Part 4: Enrichments & Connecting the Dots
2Min read
•
Cyber Attacks,
Cybersecurity,
dns,
malware,
IOCs,
DNS Server,
threat severity,
ioc analysis